Batch chart generator
Published Oct. 12, 2021
- Shell script with prompts to navigate script options
- Leverages the Datawrapper API with DatawrappeR to duplicate and update a chart template
- Google Sheets API integration to download data and upload output files
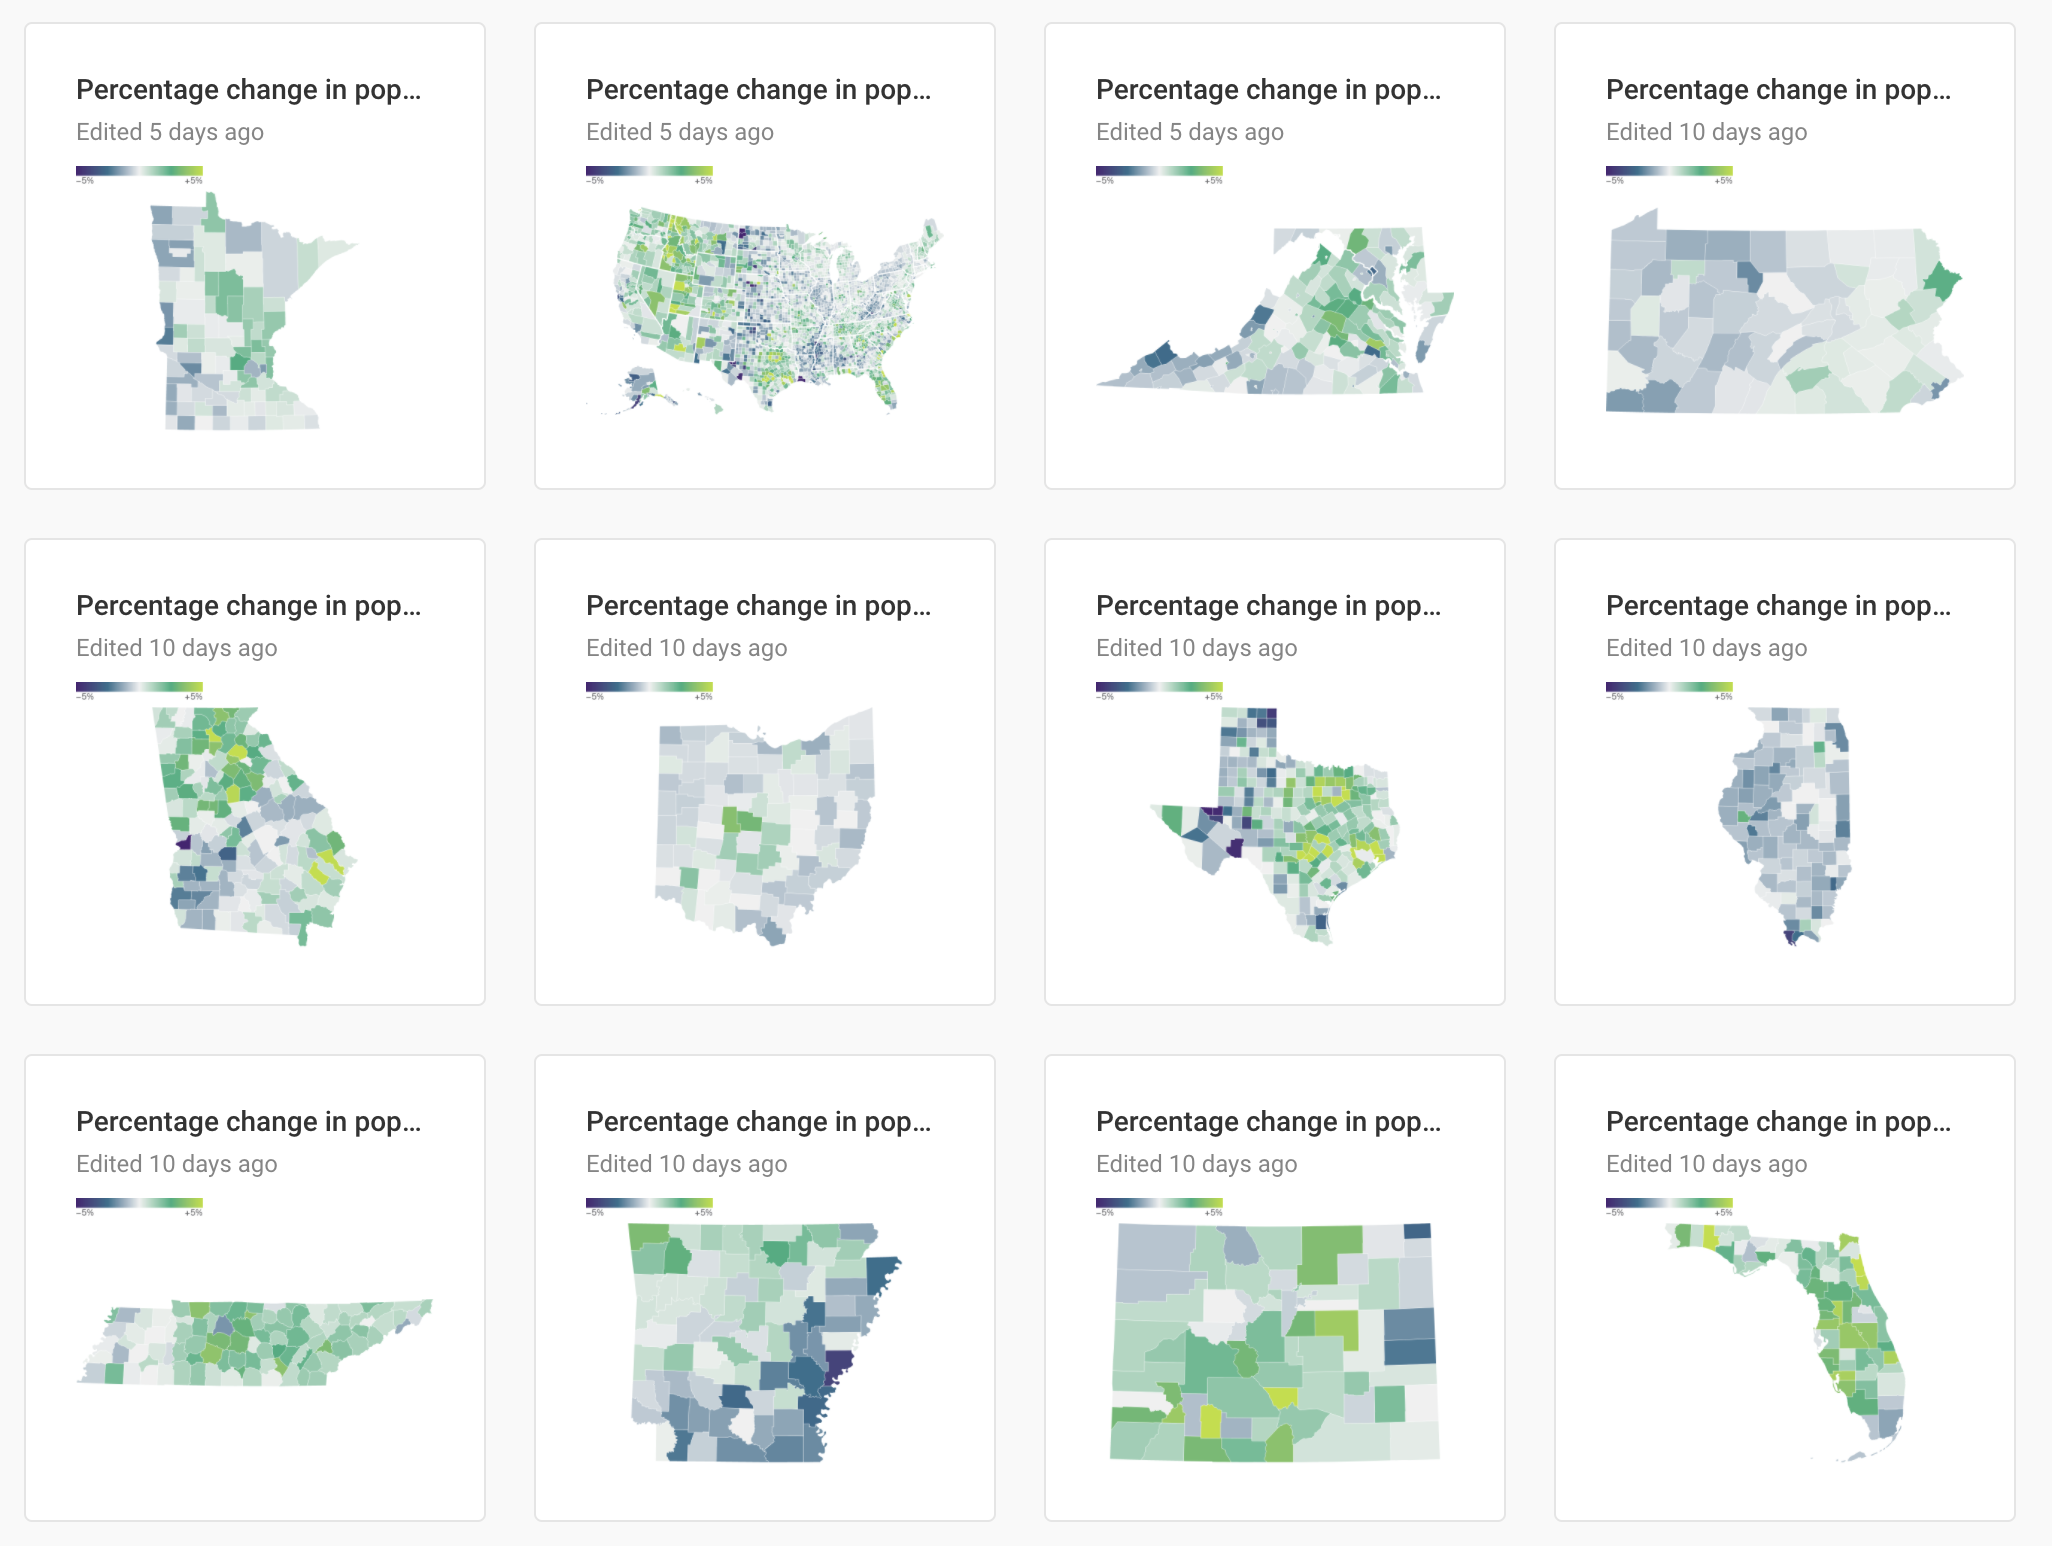
This was a project born out of laziness, or at least a desire to do less tedious work. Axios publishes newsletters in multiple cities, and it is often the case that multiple locals will want a chart using the same dataset. Prior to this script, that would mean some form of manually creating a chart for each local. This was unsustainable, especially as Axios expands into more cities. So I created a workflow using Bash and R that automates most of the work.
Using DatawRappr, an R wrapper for Datawrapper’s API, the script takes a base chart or map and iterates over a tidy dataset to create and publish for each version. It also uses a %var% templating pattern to update text fields like the title and description. After creating the batch, a reference sheet with each chart’s embed code is uploaded to Google Drive for reporters to access.