Visualizing the 2017 wildfire season
Towards Data Science
Published April 23, 2019
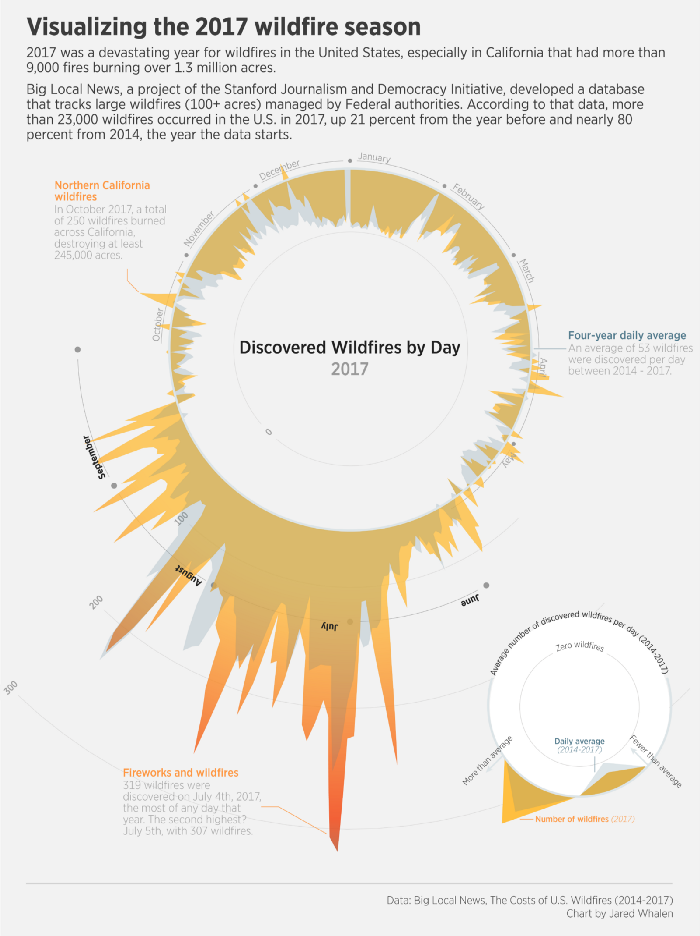
2017 was a devastating year for wildfires in the United States, especially in California that had more than 9,000 fires burning over 1.3 million acres
Published April 23, 2019